August 2025 updates to Clean Growth Tool:
In August 2025, RMI updated the Clean Growth Tool to include several new features. These revisions are described below.
Data recency : Economic complexity and industry feasibility estimates for geographies now reflect 2024 Lightcast employment data.
Geographic scope : Industry feasibility data is now available for 119th Congressional Districts and for Micropolitan Statistical Areas in addition to Metropolitan Statistical Areas.
Related indicators : Beyond economic complexity and cleantech industry feasibility information, the Clean Growth Tool now features data on cleantech deployment trends, socioeconomics, electricity-grid carbon intensity, and cleantech manufacturing investment. This data appears in the National Trends section.
Federal policy support : Users can now evaluate an area’s feasibility for industries specifically supported by a selection of federal clean energy credits.
Industry and geographic granularity : County-level economic complexity and industry feasibility data at the six-digit NAICS level are available upon request. Please email benjamin.feshbach@rmi.org and lcarey@rmi.org with any inquiries.
Data on the Clean Growth Tool dashboard can be explored using three features: National Trends; Feasibility Landscape; and Local Feasibility.
The Clean Growth Tool
The Clean Growth Tool helps the 927 CBSAs, 436 Congressional Districts, and 51 States, identify opportunities for clean growth in their region. The clean energy economy was loosely defined prior to the team’s work. We utilized the North American Industry Classification System (NAICS) and identified 283 energy transition industries. The transition industries were further categorized into sectors, sub-sectors and primary products & technologies. The tool places industries into three groups: (1) clean and underdeveloped, (2) clean and developed and (3) developed. A region can then choose industries to invest in based on these groupings and different trade-offs, including how feasible an industry is for the area, the percentage of good jobs the industry has to offer or the complexity of the industry. If an area is interested in building out a specific sector, such as the ‘Transition Enabling’ or ‘Buildings End-Use,’ the planner can view the sectors each industry falls into by clicking on the arrow next to the industry. The user can then add those industries and work toward developing the necessary workforce. After an industry or set of industries are selected, the workforce development opportunities are shown. An area can see the most critical occupations for each industry and where their workforce currently stands. The interactive tool gives policymakers and developers the opportunity to transition based on the region’s own needs and priorities utilizing real-time data.
The project was conducted in collaboration with RMI, as well as David Hart and Chad Smith at George Mason University.
Project Team
This underlying data for this project was produced by the Brookings Workforce of the Future Initiative, in collaboration with RMI, as well as David Hart and Chad Smith at George Mason University.
The Workforce of the Future Initiative (WOF)
At Brookings, we are dedicated to empowering policymakers and companies with data-driven insights into the ever-evolving labor markets of today. Led by fellow Greg Wright, the Workforce of the Future initiative focuses on providing valuable research and interactive tools that identify high-impact strategies for economic and workforce development. Our ultimate goal is to create good jobs and promote upward mobility for workers in an ever-changing world. The WoF initiative has garnered support from renowned organizations such as the Bill & Melinda Gates Foundation, Google.org, and the Mastercard Center for Inclusive Growth.
This visualization and the comprehensive research behind it were meticulously developed by the WoF team. The talented team members include Greg Wright, Ian Seyal, Alex Cordero, and Carlos Daboin. We would like to extend our gratitude to Lightcast for providing their valuable data to researchers.
Clean Growth Tool Methodology
The Clean Growth Tool provides an interactive guide for economic and workforce planning at the U.S. Metropolitan Statistical Area (MSA) and Economic Area (EA) levels. In the ‘Region View,’ the tool first uncovers the clean energy industry opportunities that are most feasible for each of these areas; in other words, the industry transitions that best leverage an area’s underlying capabilities. Next, the tool allows industry stakeholders and policy-makers to explore the potential skills gaps that are implied by the choice of priority industries. In the ‘Industry View,’ the tool displays which areas are most feasible for a given industry to develop in, given its underlying economic and workforce capabilities.
FeasibilityThe notion of industry “feasibility” is central to the process of guiding users toward their own clean energy industrial strategy. A region’s underlying capabilities determine how feasible a given industry strategy will be. Local capabilities can be inferred from historical production patterns and summarized in a feasibility measure using methods introduced by Hidalgo and Hausmann (2009) at Harvard’s Center for International Development. In short, the tool calculates the feasibility of every clean energy industry for each location by noting that if two industries historically tend to locate in the same areas then they must require similar local capabilities. Extending this idea to all combinations of clean energy industry pairs allows us to use a location’s existing industry base to generate a measure of the likelihood that any industry will be successful in that area.
This feasibility measure is highly predictive of the industries that will thrive in a location. Across all MSAs and industries, total future job creation is highly, positively correlated with an industry’s initial feasibility. Comparing the least feasible industry with the most feasible industry over a five-year period, around 90 more jobs are created in the most feasible industry.
Workforce Development and Skills GapsOnce priority clean energy industries are identified, their feasibility can be weighed against the priorities that local planners have set for the region. For instance, planners can use the tool to search for feasible industries that have a high share of good jobs for workers without a college degree. And with an industry strategy in hand, the tool then allows users to explore the workforce implications of that strategy for their region. Alternatively, a region may already have a detailed industry strategy in mind and could simply use the tool to understand where the region’s current workforce stands relative to what will be required to implement the strategy.
Furthermore, once industries are selected, economic and workforce development planners can identify skills gaps based on occupational data from the Bureau of Labor Statistics . Skills gaps are calculated the occupation’s share of the regional workforce relative to the national average, otherwise known as the ‘Location Quotient.’ Therefore a Location Quotient of 0.14 for “Extraction Workers,” for example, infers that a region only has 14% of the share of Extraction Workers as the national average, suggesting one area for possible workforce development planning.
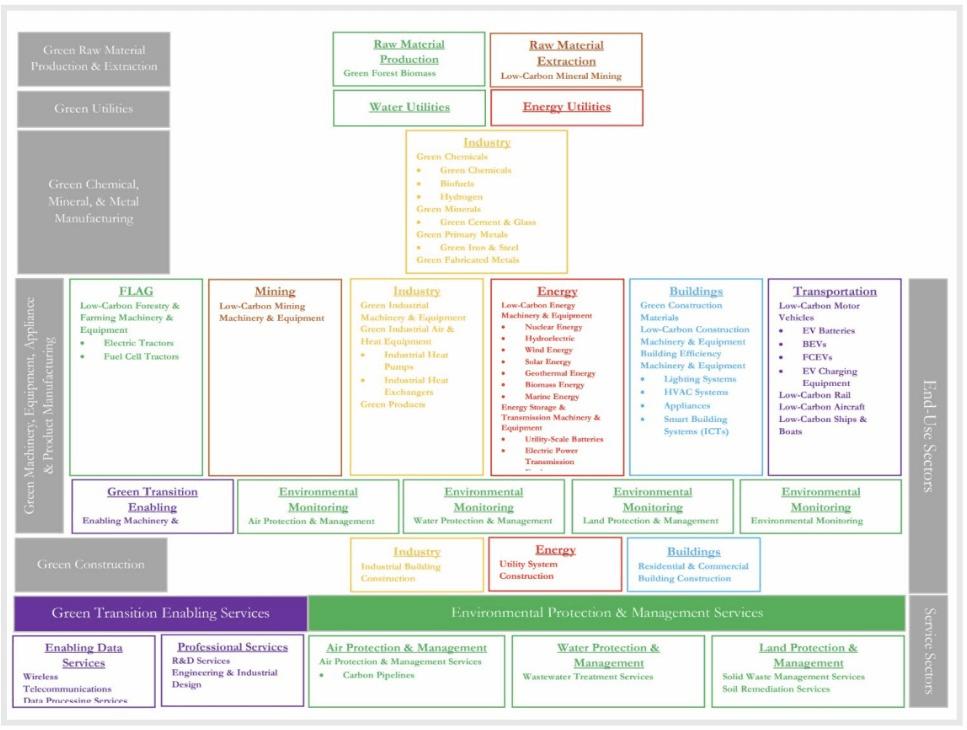
Clean Energy IndustriesThe Tool defines energy transition industries s as those with the potential to participate in the energy transition technology supply chain. A diagram below illustrates how clean energy technologies and related services fit within the overall energy transition economy, and a formal list of all 283 six-digit energy transition industries can be found below. This definition identifies industries that have the capacity to transition but may be at varying points along the path to decarbonization. This includes everything from raw materials extraction, through processing and technology manufacturing, to the enabling services and environmental management necessary to facilitate an economy-wide transition.
The selection of industries was based on whether they have above a certain percentage of “green” products or technologies. For products, we identified 523 unique green products based on the following databases: WTO Reference Universe, WTO Core List, OECD 1999 List, OECD 2014 CLEG List and APEC list, which was cross-referenced against Green Transition Navigator’s green products list. The list of green technologies (i.e patents) is from the OECD’s green patent categories list . The industry categories listed all met this threshold.
Definitions/GlossaryFeasibility : A score that measures how related an industry is to all the high-concentration industries in a region, in terms of those industries’ shared productive capabilities. It’s been shown in multiple economic development contexts that activities more related to the other activities concentrated in a region are more likely to thrive. Thus, this metric can be used to predict which industries are more likely to appear in a region —or grow faster than the average — in terms of employment or output.
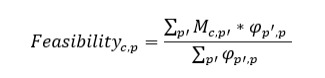
Where Mc,p is the matrix of local concentration and Φp,p is the matrix of proximities or capability similarities.
Industry Complexity : A metric that describes industries' capability requirements, based on the industry's ubiquity and whether it is present in cities with a diverse composition of other industries. Complex industries, such as computer systems design, concentrate only in a few cities, and those cities also tend to have many other complex industries. It is important to consider the industrial diversity of a city to mitigate distortions in our measure caused by industries such as metal ore mining that are rare but not necessarily complex.
As higher complexity industries start to succeed in a city, the city’s overall economic complexity increases, which leads to more innovation and economic growth. Thus, it makes sense for regional officials to target ICI when prioritizing economic growth.
Good Jobs : We use the IPUMS American Community Survey (ACS) microdata to calculate the fraction of jobs classified as “good jobs” within each industry and Metropolitan Statistical Area.
Good jobs are defined as those paying at least the local median annual earnings for full-time workers while providing employer-sponsored health insurance—a proxy for other types of employment benefits. We also look at the intersection of good jobs and educational attainment to identify the fraction of jobs that are “good and attainable for workers without a bachelor’s degree” within each industry. We use the average share of good jobs by occupation and place to impute missing (or low power) shares of good jobs.
Both the share of good jobs and the share of good jobs held by workers without a bachelor’s degree can be helpful for strategies prioritizing high-quality labor market opportunities.
Clean Energy Industries Framework and NAICS Crosswalk